
What explains the latitudinal diversity gradient? Why, in particular, are there so many tree species in tropical forests compared to temperate forests? A hypothesis dating back to the 1970s is that if natural enemies, such as insect herbivores and pathogens, are more active in the tropics, then any one tropical tree species will be prevented from becoming too common, and more tree species can thus be packed into a single tropical forest. The control of species’ abundances through such mechanisms is termed “conspecific negative density dependence” (CNDD). Last year, a global forest analysis of 24 sites published by LaManna et al. (2017) in Science claimed to have found evidence in favour of this hypothesis, in the form of stronger CNDD in tropical forests than in temperate forests.
Unfortunately, the analysis by LaManna et al. is flawed, as we show in a Technical Comment published in Science today. Their main mistake was to use an unusual statistical trick, which involved transforming some points in their data set but not others, prior to analysis. More specifically, they split the data at each site into quadrats (of 10 m × 10 m or 20 m × 20 m) and inferred CNDD from the static relationship between saplings and adults of each species across quadrats, and they transformed any quadrat with saplings and no adults by adding +0.1 to the adult abundance. The latter step—the “selective transformation”—affected more data points in tropical than in temperate plots, which ultimately led to a greater bias in CNDD estimates in tropical plots and an artefactual latitudinal gradient in CNDD. LaManna et al. also failed to include an intercept term in their fitted model, even though the data clearly suggest the need for an intercept term, and biologically an intercept term is needed to account for immigration. In our Technical Comment, we explain these mistakes by LaManna et al., perform a more appropriate statistical analysis, with no selective transformation but with an intercept term, on the same data. We find no statistically detectable latitudinal trend in CNDD (see figures below).
Lisa Hülsmann and Florian Hartig from the University of Regensburg have published an accompanying Technical Comment today showing that the methods used by LaManna et al. yield similarly strong patterns even when applied to simulated data sets in which there is no CNDD. This confirms that the patterns observed by LaManna et al. result from biases inherent to their statistical methods rather than any real biological processes. You can read Lisa and Florian’s own blog post on the subject here.
Matteo Detto and Marco Visser of Princeton University are also preparing a paper critiquing the LaManna et al. analysis. They show, consistent with what Hülsmann and Hartig found, that the methods of LaManna et al. produce apparent latitudinal patterns in CNDD even when applied to null models with no CNDD.
The hypothesis that the latitudinal diversity gradient is driven by latitudinal variation in CNDD remains intriguing, but we conclude that the forest data set analysed by LaManna et al. provides no evidence in support of it.
We have uploaded R code and step-by-step instructions here for reproducing our results for the tree species in the Barro Colorado Island forest plot in Panama (Fig. 1 in our paper).

Fig. 1. These graphs show how the model of LaManna et al. (2017) (red) completely distorts the trend in the data (black) for two representative species at the Barro Colorado Island plot. Our model (green) provides a much better fit. These two species are typical. (Reprinted from Fig. 1 in our paper.)
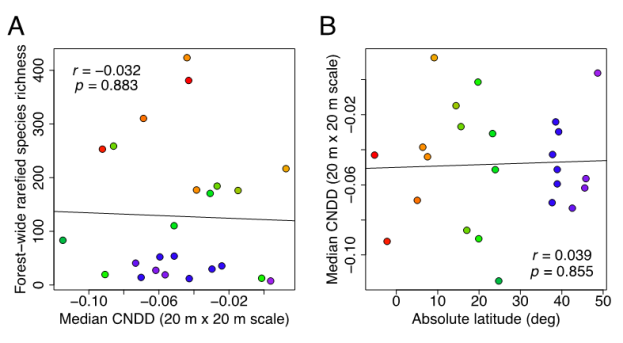
Fig. 2. Our corrected analysis of the global forest data set used by LaManna et al. (2017) reveals that conspecific negative density dependence (CNDD) exhibits no statistically significant relationship to tree species richness (A) or latitude (B) (for comparison with Figs. 1E and 1C in LaManna et al. respectively; reprinted from Fig. 2 in our paper).

Fig. 3. Our corrected analysis also shows no systematic pattern in the relationship of CNDD vs. abundance across latitude. Each line here represents one site, with warmer colours indicating lower latitudes as in Fig. 2D of LaManna et al. (2017). This figure was not included in our paper due to lack of space.
UPDATE: A response by LaManna et al. (2018) was published at the same time as our critique. We did not get to see this response before it was published; if we had seen it, we would have been able to correct several misconceptions.
In their response, LaManna et al. correctly point out that if only the first of the statistical problems we identified is fixed, i.e., if all the data points are transformed instead of just some of them, their overall results remain statistically significant. What they omit to mention is that, under this same scenario, their estimates of median CNDD across species drop from −2.33 to −0.73. In other words, their decision to transform a subset of the data rather than all of the data inflated the magnitude of their main variable of interest by 200%. The inflation is even more extreme for rare species: for the rarest 5% of species, the decision to transform only a subset of the data inflated median CNDD by 600%.
LaManna et al. further claim that our solution to the second statistical problem, which involved adding an intercept to the Ricker model, is not valid, because the Ricker model already has an intercept. We cannot fathom the basis for this claim. The Ricker model is y = x exp(a+bx), which fundamentally does not have an intercept term: the curve always passes through the origin {0,0} (e.g., see Fig. 1A in the response of LaManna et al. (2018)). By “intercept” we simply mean a term that would allow y≠0 when x=0, which in this case would represent immigration leading to saplings in a quadrat (y>0) even when there are no adults present (x=0).
LaManna et al. argue further against our intercept term by claiming that it is confounded with other parameters in the model. Our response is that if two parameters in a model are confounded to some degree, the solution is not to arbitrarily remove one of them and attribute the entirety of the effect to the other. By neglecting to add an intercept term to their model, LaManna et al. produce highly distorted curves that bear little resemblance to the true trends in the actual data (see Fig. 1 above).
LaManna et al. claim that our result of generally weak CNDD “contradicts previous experimental demonstrations of strong CNDD for several tropical and temperate species in our study”. But the experimental studies show simply that CNDD exists, not that it should necessarily manifest itself as a large effect in forest census data.
LaManna et al. also present a new distance-weighted model that produces results that are qualitatively similar to their original results, and they run some new benchmark tests showing our model is supposedly biased, whereas theirs is not. It appears their new model still suffers from the statistical problem of being anchored at the origin, which produces artefacts even if, as in their new model, there are no data at precisely x=0. We will respond in detail to these new claims in a future peer-reviewed publication; we cannot respond immediately because LaManna et al. have not made their full code and data available.
In summary, we stand by our original claims that LaManna et al. (2017) made a series of unusual statistical choices whose effect was to massively inflate the magnitude of their main variable of interest (CNDD), especially for rare species, and distort the trends in the data (Fig. 1 above). These statistical decisions led to the artefactual latitudinal trend in CNDD and other patterns observed by LaManna et al. (2017). In our corrected model the trends disappear (Fig. 2 above). In their revised model (LaManna et al. 2018), they appear to have corrected one problem we identified (the selective transformation) but not the other (the forced zero intercept), and so we suspect their overall results are still artefactual.
References

Pingback: Does conspecific negative density dependence in forests really correlate with species rarity and latitude? | theoretical ecology
Pingback: New coauthored <em>Nature</em> paper on the impacts of conspecific neighbours on forest tree survival | Chisholm Lab